Saturday, December 19, 2009

Extrinsic Vertices

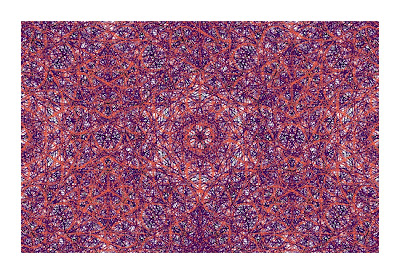
Extrinsic Vertices are lattices and patterns developed from tilings of polygons. I create edge-to-edge tilings or tile patches, and then plot the extrinsic vertices of potential tiles, creating a lattice structure. From these lattices I germinate patterns. The pattern lines extend out from the vertices of tiles and potential tiles.

The processes, lattices, and patterns in this project are not math. I’m influenced by structures in math, science, architecture, and design, but unconstrained by the rigorousness of math. The patterns have no practical use or purpose beyond this project.

Extrinsic vertices and potential tiles are terms that describe objects unique to this project. They are elements I designed to create lattices and patterns, but are not recognized elsewhere. I begin with tile sets of two or more regular polygons, rectangles, isosceles triangles, isosceles trapezoids, or rhombuses. The selection and arrangement of tiles is not necessarily predetermined as in a periodic or symmetrical pattern. At any step in building a tiling I can make multiple selections from the tile set, each with potential vertices. The vertices of potential tiles are extrinsic to the tiling. These vertices lie in characteristic dot patterns or lattices depending on the angular properties of the tile set.

I almost always borrow from math a preference for edge-to-edge tilings, simple polygons, and filling the plane with no gaps or overlaps. In contrast to typically symmetrical tilings like those in Islamic architecture, I often opt to create nonperiodic tilings, to select asymmetry. Ultimately I obscure the tilings with overlapping patterns.

These designs begin with tile patches, not in fact tilings or tessellations. They are tile patches – a finite number of tiles from some tiling. All of them could be extended, and most if not all might fill the plane if extended. However, it’s not necessarily clear how they would be extended or what a tiling extending any patch might look like.

My tilings based on a pentagon tend to include polygons with angles that are multiples of 18 degrees. Those based on a hexagon tend to include polygons with angles that are multiples of 30 degrees. Tilings based on a square tend to include polygons with angles that are multiples of 45 degrees. Tile sets with just one of these three angle groups have vertices and extrinsic vertices that lie in characteristic patterns depending on the angles used. Other mixed tile sets have their own characteristic vertex lattices. As tilings become complex with mixed tile sets the lattices reveal new patterns characteristic of the tile set, often repeating rosettes.

For reference, I refer you to the dot patterns described in Tilings and Patterns, by Grunbaum and Shephard (p. 238-246). Some of my simplest lattices correspond to Bravais lattices in 2 dimensions. The more complex lattices are possibly overlain combinations of dot patterns or lattices. I emphasize that the images and techniques in this project are not math.

I advocate using complex technology to create art that mimics natural beauty. If you know the technology and use it assertively, resolutely, and creatively you can produce something new and interesting. If it’s a bit innovative it might also be instructive, at least for other interested artists. Maybe it opens a path with potential. You can work with the natural beauty of math, though no one is likely see it in your work. You can also mimic or parallel nature. I do this kind of art because I think I’m particularly good at it: connecting, organizing, coding, elaborating, extending systems, following narrow paths that haven’t been pursued.

Wednesday, October 21, 2009

Tiling, Bravais Lattice, Squiggles

This is the first successful image in a new project that grew out of my tilings project. I created the image in three steps. First, I made a non-periodic tiling. Then I generated a lattice of vertices including all potential vertices around each tile. Then I plotted a shape or lines (in this case, a squiggle) at each lattice point. The plot of vertices is somewhat like a Brazais lattice, though I'm extending this math concept for my own purposes.

Tilings of the plane using tile sets of regular polygons, rectangles, isosceles triangles, trapezoids, and parallelograms, have vertices that lie in characteristic patterns or lattices depending on the properties of the polygons — its angles and sides. The Bravias lattice system categorizes these patterns. The five Bravais lattices for two dimensions approximate the arrangement of vertices of simple periodic tilings. I'm applying this concept to complex, non-periodic tilings with large tile sets.

Thursday, September 24, 2009

Storm, Sepia Approach (Hexamerism Lost)

This is titled "Storm, Sepia Approach". The tile set could have made a hexameric tiling starting with the center hexagon. I forced the off-balance tri-radial asymmetry.

Gratuitous link: I suggest you look at the paintings of Janice Biala.

Sunday, September 20, 2009

Pentamerism

This is the only non-periodic tiling I've done that is pentaradial. It has five polygons, but the square and rectangle (which has an aspect ratio of 1:1.618033989) can only be used along the five rows extending from the center pentagon. If I attempt to use them anywhere else, a gap is created.

Monday, September 14, 2009

Camouflage

In 2007, the Portland Art Museum exhibited Camouflage, an exhibition of eight paintings that explored artists’ use of pattern. The exhibit included a large camouflage pattern painting from a series that Andy Warhol did around 1986.

In his 1940 essay, A Mathematician's Apology, G. H. Hardy (full text here) discusses, among other things, pure versus applied mathematics with one difference being the application of mathematics to war. He stated that "a mathematician was a maker of patterns of ideas, and that beauty and seriousness were the criteria by which his patterns should be judged".

In Arthur Danto's The Transfiguration of the Commonplace: A Philosophy of Art, and 25 years later in his 2008 reply to his critics in CA online, Danto uses Warhol's Brillo box to discuss what makes an object an art work. (See Ontology, Criticism, and the Riddle of Art Versus Non-Art in The Transfiguration of the Commonplace. Contemporary Aesthetics, Volume 6, 2008.)

The Warhol camouflage series is interesting in that it turns a pattern designed for war back into art. Hardy said "A painting may embody [an] 'idea', but the idea is usually commonplace and unimportant." I wonder what he would have thought about the Warhol painting's ability to wrap all these concepts — beauty, seriousness, the ontology of art — in one art work.

Here's an unrelated, gratuitous Bezier curve image from a series:

Wednesday, September 2, 2009

Here are a few close-up pictures of a painting (a polyptych) just under way. It will resemble the digital print, Slip, but will undoubtedly have a completely different color scheme. I shot these as close as I could to show what I look at all day while I'm laying down these outlines in white on white oil paint. All the curves are paint applied with a small brush along pencil lines. The pencil lines are plotted/interpolated Bezier curves. That is, I plot about ten points per curve, and interpolate with ships curves or other French curves. The plots follow a spreadsheet of grid points that I exported from the original digital print program data.


Sunday, August 9, 2009

Erosion

First test drawing of new program about erosion and alluvial fans:

Wednesday, July 8, 2009

Beziér Curve Drawing

The developer-artist has the ability to collaborate with a client, and enhance understanding of the project in the process. The client can propose a requirements list or request permutations based on variables built into a program. Architects, engineers, and designers work with developers to extend or modify software, achieving through collaboration a client-directed variation. The artist-developer creates a program which reveals more through the interjection of client requirements than an artwork rendered from just the artist's requirements.

This new "Beziér Curve" drawing was created with a Flash Air program written for managing and creating modules and whole drawings within this project. It's meant to explicitly demonstrate modularity open to client requirements. The client can dictate requirements for the arrangement of squares, the selection of curves within, the color and thickness of line, overall scale, or as yet to be determined requirements.

Saturday, June 27, 2009

New Sequence

I finally decided to include continued fractions in my project on rectangles and spirals. While doing the research I read that "numbers with periodic continued fraction expansion are precisely the irrational solutions of quadratic equations with rational coefficients." My previous rectangles and spirals were all based on irrational solutions of quadratic equations. So, this got me thinking that all I needed to do was start with a periodic continued fraction, and I might find another series of rectangle and spirals similar to the golden rectangle. The continued fractions for my second sequence are:
[1; 3,1,1,3,1,1,3,1,1, …]
[1; 7,1,1,7,1,1,7,1,1, …]
[1; 15,1,1,15,1,1,15,1,1, …]
[1; 31,1,1,31,1,1,31,1,1, …]
etc. . . .

So, I decided to start with a similar sequence. The continued fractions I came up with are:
[1; 2,1,1,2,1,1,2,1,1, …]
[1; 4,1,1,4,1,1,4,1,1, …]
[1; 6,1,1,6,1,1,6,1,1, …]
[1; 8,1,1,8,1,1,8,1,1, …]
etc. . . .

And, the corresponding ratios look like:
b/(a–2*b/3) = a/b
b/(a–2*b/5) = a/b
b/(a–2*b/7) = a/b
b/(a–2*b/9) = a/b

I haven't drawn the spirals, but I think they look a lot like my second sequence.

Friday, June 5, 2009

Hackers and Painters

Hackers and Painters, the essay: http://www.paulgraham.com/hp.html

Hackers and Painters, the book: http://www.paulgraham.com/hackpaint.html

Gratuitous tile set image made with a Flash Air program written by a painter:

Thursday, May 28, 2009

Radical Non-periodic Tiling

This tiling is from a set of seven tiles, including the pentagon. It's the latest in a series of tilings.

Monday, May 4, 2009

Animated Radial Tiling

Here's an initial test version of animated radial dart-rhombus tilings.

Saturday, March 28, 2009

Tile Sets

I have my Air tiling program under control, and I'm using it to generate asymmetrical tilings from tile sets I design myself. The tile sets are all periodic, could be used to generate a variety of symmetrical tilings, but I arrange them in asymmetrical and non-periodic tilings.


Saturday, March 14, 2009

Tiling No. 2

Possibly out of control. From the same tile set as No. 1.

Friday, March 13, 2009

Tiling No. 1

This is the first successful test of a new tiling program. The program allows me to create custom tile sets, and tilings from the tile set. This is still just a preliminary test of the program, to show that the code generally works, so the colors are not important

This particular tiling is one I tried to draw by hand. The tiling could be extended to fill the plane. It's non-periodic, but the tile set itself is not aperiodic. This is a great improvement on my previous tiling program, which generated only radially symmetric, dart-rhombus tilings. Having the ability to do asymmetric tilings is liberating.

This is my first program with AS3, my first Air program, and my first OOP program. I'm excited.

Wednesday, March 4, 2009

Nanotube Forests and Diatoms

Compare these images of carbon nanotube arrays, created by John Hart, of the University of Michigan, with the Ernst Haeckel drawings. Last year I covered a Scientific American magazine article on the 2008 BioScapes Photo Competition: story and photos, and the Nikon Small World Photomicrography competition. There are more amazing scanning electron microscope images, including nanotubes, here.

And, in the latest Scientific American on line there's a scanning electron microscope slide show by University of Georgia digital media professor, Michael Oliveri.

For another view of things small see SnowCrystals.com.

The 4th plate from Ernst Haeckel's Kunstformen der Natur (1904), depicting diatoms (Diatomea).

Here's a gratuitous image, possibly tube-shaped like the nanotubes, from my sinusoidal grids project:
References
Bourzac, Katherine (2009). "Growing Nanotube Arrays", MIT Technology Review online, March/April, 2009.
http://www.technologyreview.com/computing/22095/?a=f

Tuesday, February 10, 2009

Tree of Life Diagrams

In previous blogs about Ernst Haeckel I pointed to his amazing drawings of animals and sea creatures. He also published the evolutionary tree, below, showing how humans and animals evolved from single-celled creatures.

Haeckel's diagram was published in 1879, forty-two years after Charles Darwin wrote "I think" above his sketch, probably the first diagram of it's kind.

With DNA sequencing we now have this amazing diagram of the evolutionary tree. See the University of Texas source and a New York Times article.

Mac users can download a 3-D version of the diagram by M. J. Sanderson here: http://loco.biosci.arizona.edu/paloverde/paloverde.html

More on the tree of life here: http://tolweb.org/tree/phylogeny.html

References
Zimmer, Carl (2009). "Crunching the Data for the Tree of Life", The New York Times online, Feb. 9, 2009.
http://www.nytimes.com/2009/02/10/science/10tree.html?_r=1&pagewanted=1

Wikipedia contributors, "Kunstformen der Natur" Wikipedia, The Free Encyclopedia, http://commons.wikimedia.org/wiki/Kunstformen_der_Natur (accessed February 11, 2009).

Wikipedia contributors, "Charles Darwin", Wikipedia, The Free Encyclopedia, http://en.wikipedia.org/w/index.php?title=Charles_Darwin&oldid=269994913 (accessed February 11, 2009).

David M. Hillis, Derrick Zwickl, and Robin Gutell, University of Texas. "Download Graphic Images from the Hillis/Bull Lab, Tree of Life Poster and Other Graphic Images", http://www.zo.utexas.edu/faculty/antisense/DownloadfilesToL.html
(accessed February 11, 2009).

Sunday, February 8, 2009

Alicia Boole Stott

Alicia Boole Stott, 1860-1940, was born in Cork, Ireland. Although she never studied mathematics she was able to visualize geometric forms in hyperbolic space. She is remembered for finding all three dimensional sections of the four dimensional polytopes and for discovering many of the semi-regular polytopes. She coined the term "polytope" to refer to a convex solid in four dimensions. She built beautiful models of polytopes.


"Perpendicular sections of the 600-Cell. Section number 7." Alicia Boole Stott
The University of Groningen, Netherlands
http://www.math.rug.nl/models/Alicia.html

References
Riddle, Larry (LRiddle@AgnesScott.edu). "Biographies of Women Mathematicians, Alicia Boole Stott". Agnes Scott College, Atlanta, Georgia.
http://www.agnesscott.edu/Lriddle/WOMEN/women.htm.
Photo Credit
Blanco, Irene Polo and van der Zalm, Lotte. "Mathematical models of surfaces, Alicia Boole Stott, 600(P), nr. 7". University of Groningen.
http://www.math.rug.nl/models/

Friday, February 6, 2009

Google Earth Oceans

Two recent software releases have huge potential for influencing art based on nature and technology. The new release of Google Earth and Adobe's Creative Suite family with Flash CS4 will tempt artists open to the concepts and imagery of science. Google Earth gives us the ability to see the ocean scape, and Flash CS4 includes basic 3D object manipulation capabilities. Web designers and developers have increasingly influenced artists, opening their eyes to all sorts of possibilities. Designers and developers working with technologists are changing the way we access science like never before. The new release of Google Earth reveals huge, amazing geological patterns in the ocean scape. The animation, data visualization, and interactive graphics capabilities of software like but not exclusive to Flash are giving scientists powerful ways to communicate ideas to the rest of us. (Also see Processing, and Rhino.)

In "Art and Nature", Arcy Douglass (writing for PORT – www.portlandart.net) brought us up to date on how artists have used natural processes and math to influence their work. A few artists have been interested in and able to absorb what science and technology have to teach. Now, science becomes more accessible, through the efforts of huge undertakings like Google, and because on a small scale thousands of technical artists and designers are working with scientists and mathematicians to improve our visualization of natural processes. Our exposure doesn't stop with our last science or math class in school. Science journals and graduate level books aren't required to tap into a lot of the amazing work going on.

Sylvia Earle said to Google, “You’ve done a great job with the dirt. But what about the water?” (See http://www.nytimes.com/2009/02/03/science/earth/03oceans.html.) The February issue of Scientific American has an excellent article explaining the origin of continuous undersea "ridges that wind around the globe like seams on a baseball." See "The Origin of the Land Under the Sea", by Peter B. Kelemen.

From Google Earth. The Pacific Ocean floor, off the coast of Maui.


From Google Earth. The Pacific Ocean floor, off the coast of southeast Mexico.


This gratuitous image from my Squared Spiral series has nothing to do with the ocean scape, but it was built in Flash Actionscript, and is influenced by the math concept of tessellation or tiling of the plane.

Friday, January 30, 2009

Squared Spiral


From a new series. Not quite as interesting as the Ulam spiral.

I've been intending to consolidate a list of Portland, Oregon artists that use some math in their work, and artists with a technical background. These are not geek artists. They are primarily interested in art and may be more or less inspired by math or technology.

I include Michael Knutson (paintings based on quasiregular rhombic tiling), Arcy Douglas (Sierpinski triangle fractals built with hexagonal tiles), Eva Lake (for her interest in the Richter Scale), and Julian Voss-Andreae (sculpture based on molecular structure, etc.). Also Stephan Soihl, and Martha Morgan (for "The Golden Ratio in Tryon Creek State Park"). More to come.

Monday, January 26, 2009

Earthquakes

A sinusoidal ridge from Sinusoidal Grids. Earthquakes happen. A noticeable rise or fall in the normal depth of coastal waters is nature's tsunami warning. Move away from the shore immediately. (See the U.S. Geological Survey Earthquake Hazards Program).

I've been trying to create a geometric representation of a landscape (mountain ridges) from a long distance, like a Google Earth image. Since I used a sinusoidal motif this reminded me of seismograph prints. So I'm combining a landscape with a seismograph-like motif.

Friday, January 23, 2009

Dart-Rhombus Recede

This is a 3-fold, dart-rhombus, radial tiling. Each dart is decorated or marked by rhombi which recede from the adjacent rhombus. This divides each dart-rhombus into ever smaller copies. Each adjacent dart-rhombus is a trivially simple fractal.


I generated this image with six rows, but I have also done a 3 row version, both of which can be seen in my Tilings project. A description of the process for generating the basic dart-rhombus structure without the decoration is here.

In these digitial drawings I superimpose an image on each tile. Sometimes the image is programmatically varied from tile to tile. In these cases the tile with its marking is no longer a true tiling in the mathematical sense, though the underlying structure is. The marking or decoration of the tiles, other than by systematic coloring, often obscures the structure. Infinitely many interesting tilings are possible without this obfuscation. I choose this approach because I'm less interested in the math than I am in inventing a quasi natural image.

Pascal Cotte and Mona Lisa at OMSI

Yesterday I was able to attend a presentation at OMSI (Oregon Museum of Science and Industry) by Pascal Cotte. OMSI is opening an exhibit on Leonardo da Vinci, featuring a whole room devoted to Cotte's 240-megapixel, multi-spectral scans of the Mona Lisa. Cotte not only invented the camera which uses 13 wavelengths from ultraviolet light to infrared; he also supervised the exhaustive analysis of the resulting images.


Through this analysis Cotte is able to reveal hidden details of how da Vinci painted the Mona Lisa, and how she appeared to da Vinci's contemporaries. The exhibit highlights Cotte's discovery of 25 secrets about the Mona Lisa, including evidence that she did in fact have eyebrows.

Saturday, January 17, 2009

Figure/Ground in Similar Tilings

These next two digital prints of tilings share almost the same code. Other than the colors, only a few minor changes were made to the program. In the first, the figure is paramount, and in the second it's the ground.


And both of the above two prints have a lot in common with the following, though the above are radial tilings, and the following is based on Fermat's spiral, not a tiling.

Monday, January 12, 2009

7-Fold Tiling

This is a 7-fold radial tiling of the plane with a dart-rhombus tile set. It's a test example in my new series of n-fold, dart-rhombus radial tilings. Technically it's not a tiling since the image in each tile is slightly modified, but it is a tiling since it is constructed from congruent dart-rhombus tiles that fill the plane.