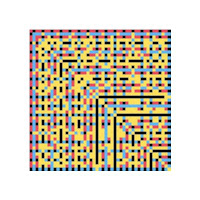
Here are ten plots, with the 47X47 column and row numbers figuring in a pair of formulas, which then are tested for a greatest common divisor, GCD, of one (
coprimes), two, and three. The background is yellow. If the GCD is one, two, or three, the cell is black, blue or red, respectively. The only things that vary are the formulas. For each plot there are two formulas, with the formula variables being row number and column number. For each cell, the two formulas are calculated, then the GCD of the numerical results are tested for one, two, or three. The cell color is set accordingly. If the GCD is something other than one, two, or three, the cell remains yellow.
a = row number
b = column number
If b>a then a and b are swapped. The formula pairs are:
1. a, b2. a3+b3, a3–b3 (Taxicab and cabtaxi candidates)3. b2+b+1, a2+a+14. b+a, b–a
5. b2+b+2, a2+a+26. b2–b+2, a2-a+17. b2+1, a2+28. b2+2b*a+a2, b2–2b*a–a29. b3+b2+b, a2+a10. 3b3+2b2+b, 2a2+a


No comments:
Post a Comment